
Jefferson Parish
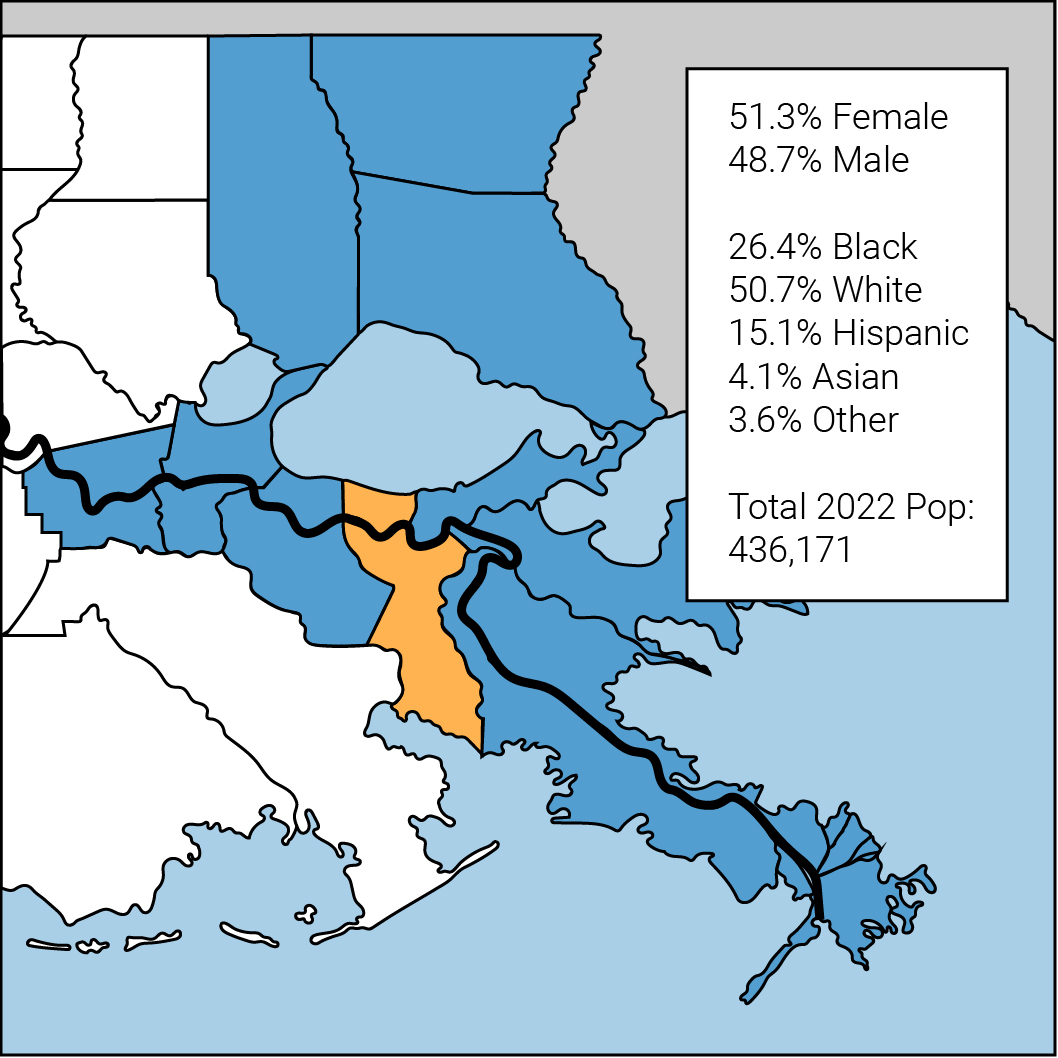
Jefferson Parish is one of the most populous parishes in Louisiana and has the largest population and the greatest job opportunity of the four southern parishes served by United Way of Southeast Louisiana. Jefferson Parish is home to 21 incorporated cities and towns, including Metairie, Grand Isle, Gretna, Harahan, Jean Lafitte, Kenner, and Westwego. In 2000, the population of Jefferson Parish was 455,466 but has declined somewhat since Hurricane Katrina.
Employment rates
Employment rates indicate the percent of the working age population that did any work for pay, including self-employment. Employment rates are a more comprehensive measure of labor market conditions than official “unemployment” rates, because they not only reveal the share of the population that are unemployed but also those who are no longer in the labor force at all — many of whom are “discouraged workers.”[i] Employment rates by race and gender suggest the extent to which structural economic changes have benefited different groups. While trends in employment rates tend to shift slowly, they can change dramatically in times of disaster, such as the current COVID-19 pandemic, before resettling to pre-disaster trends. The data in these graphs are prior to the COVID-19 pandemic.
Total employment rate
2018-2022
Employment rate by race/ethnicity and gender, Jefferson Parish, 2018-2022
Employment rate by gender,
2018-2022
Poverty rates
Changes in the poverty rate not only indicate the overall strength of a region’s economy but also show whether economic prosperity is benefiting those on the lowest rungs of the economic ladder. The geography of poverty is important because regional policymakers and social service providers need to provide social safety nets, transportation options, and job opportunities where they are most needed. Poverty status is determined by comparing a households’ annual income to a set of poverty thresholds (in dollars) that vary by household size, number of children, and age of householder.[i]
Overall, the Federal Poverty Level, with its minimal and uniform national estimate of the cost of living, far underestimates the number of households that cannot afford to live and work in the modern economy. For an estimate of the total number of people struggling to make ends meet in our region check out ALICE.
Population below poverty level by race/ethnicity, Jefferson Parish, 2018-2022
Calculations include Black, White, Hispanic, and Asian. Any exclusions are due to a high margin of error (MOE), but a full data set is available for download which includes all populations, as well as the calculated MOE.
Population below poverty level, 2018-2022
Population below poverty level by race/ethnicity and gender, Jefferson Parish, 2018-2022
Calculations include Black, White, Hispanic, and Asian. Any exclusions are due to a high margin of error (MOE), but a full data set is available for download which includes all populations, as well as the calculated MOE.
Population below poverty level by gender, 2018-2022
CHILD POVERTY RATES
By definition, poverty for children is a function of their family’s household income. In other words, the wages of adult family members determine whether children within the household live in poverty. Poverty status is determined by comparing a family’s annual income to a set of poverty thresholds (in dollars) that vary by family size, number of children, and age of householder.[i] If a family’s pretax income is less than their given poverty threshold, then that family and every individual in it are counted as living in poverty.
Scientific research has shown that child poverty can lead to chronic, toxic stress that disrupts the architecture of the developing brain. Children in poverty are much more likely to experience exposure to violence, chronic neglect, and the accumulated burdens of economic hardship. This kind of chronic stress causes prolonged activation of the stress response system which, in turn, can disrupt the development of brain architecture, leading to lifelong difficulties in learning, memory, and self-regulation.[ii] In short, scholars argue that poverty may be the single greatest threat to children’s healthy brain development.[iii] Moreover, child poverty has been linked to poor health outcomes in adults.[iv]
Percent of children under 18 below poverty level by race/ethnicity, Jefferson Parish, 2018-2022
Calculations include Black, White, Hispanic, and Asian. Any exclusions are due to a high margin of error (MOE), but a full data set is available for download which includes all populations, as well as the calculated MOE.
Percent of children under 18 below poverty level, 2018-2022
PERCENT OF HOUSEHOLDS EARNING BELOW A LIVING WAGE
The federal definition of poverty, first created in 1964, was based on data that indicated family food costs were about one-third of a family’s budget. The federal government estimated the cost of a nutritionally adequate diet in 1964 and multiplied that by three to come up with a minimum family budget. Housing costs have risen much faster than food costs since 1964. Moreover, poverty rate calculations are not adjusted for differences in standards of living in different parts of the country. Neither does the official poverty rate take into consideration non-cash government aid, such as Medicaid or housing subsidies. Several experts have worked to develop an alternative measure to identify families above the Federal Poverty Level who still do not earn enough to meet their most basic needs. Examples include United Way’s ALICE (Asset Limited, Income Constrained, Employed) report and Massachusetts Institute of Technology’s (MIT) living wage calculator. Notably, ALICE and MIT’s living wage thresholds do include child care and health care costs, which are determining factors in many adults’ ability to work. Both thresholds are still conservative because they do not factor in the need to save for retirement and higher education.[i]
Households earning below a living wage by race/ethnicity, Jefferson Parish, 2018-2022
Households earning below a living wage, 2018-2022
Industry employment and wages
The jobs in a parish can be divided into industries that bring in revenue through trade with consumers and businesses located outside the region, and local-serving industries that primarily serve local residents (such as retail, restaurants, and local government). Jobs in “traded” industries are considered the drivers of regional economic growth and tend to pay higher wages. In contrast, jobs in local-serving industries are more numerous, but tend to pay lower wages on average.
The types of jobs in a parish do not necessarily dictate the opportunities available to residents because workers can commute to other parishes for higher-paying employment. However, local businesses, policymakers, and workers may be interested in understanding the economy of their home parish, because a parish with many traded industry jobs may provide good opportunities, but only if residents have accumulated the skills for these specialized positions. On the other hand, parishes with a large share of local-serving jobs may provide employment for many lower-skilled workers, although residents may have to commute long distances to access higher paying opportunities elsewhere in the region.
Traded and local-serving jobs average earnings, Jefferson Parish, 2022
Note that while the average earnings given above are useful in showing differences between local-serving and traded industry earnings overall, they do not necessarily reflect a typical worker’s wage and salary earnings or economic status. Averages may be skewed by a small number of very high-earning jobs. Numbers such as median household income provide a more accurate reflection of a population’s economic status.
Traded and local-serving jobs total, Jefferson Parish, 2022
Traded and local-serving jobs average earnings, Louisiana, 2022
Note that while the average earnings given above are useful in showing differences between local-serving and traded industry earnings overall, they do not necessarily reflect a typical worker’s wage and salary earnings or economic status. Averages may be skewed by a small number of very high-earning jobs. Numbers such as median household income provide a more accurate reflection of a population’s economic status.
Traded and local-serving jobs total, Louisiana, 2022
Traded and local-serving jobs average earnings, United States, 2022
Note that while the average earnings given above are useful in showing differences between local-serving and traded industry earnings overall, they do not necessarily reflect a typical worker’s wage and salary earnings or economic status. Averages may be skewed by a small number of very high-earning jobs. Numbers such as median household income provide a more accurate reflection of a population’s economic status.
Traded and local-serving jobs total, United States, 2022
Note that while the average earnings given above are useful in showing differences between local-serving and traded industry earnings overall, they do not necessarily reflect a typical worker’s wage and salary earnings or economic status. Averages may be skewed by a small number of very high-earning jobs. Numbers such as median household income provide a more accurate reflection of a population’s economic status.